

Field Service by the Numbers: September 2026 Stats Roundup
A September 2026 field service statistics roundup for owners and analysts, turning labor, demand, technology, and market signals into practical dispatch-board decisions.

Field service statistics are only useful when they change the way an owner, analyst, or dispatcher reads the week ahead. This September 2026 roundup treats the numbers as operating signals, not trivia: labor pressure, demand timing, technology adoption, and the practical choices that show up on the dispatch board. The goal is not to crown the best field service statistics in abstract. It is to help a small business decide which industry data deserves attention, which trend is only background noise, and where a monthly review can sharpen staffing, scheduling, and customer promises.
This month's headline number
The headline number for any monthly roundup should be the one that changes a decision. In field service, that may come from a labor outlook, a market forecast, a trade benchmark, or a customer-demand signal. The important move is to ask what the number touches: hiring, call volume, average job duration, warranty work, route density, or cash planning.
For a clean source stack, start with public labor and occupation context from the BLS Occupational Outlook Handbook, then separate that from market-sizing sources such as IBISWorld, Grand View Research, and broad data libraries such as Statista. Those sources do different jobs. A labor source helps you read the technician market. A market source helps you understand category momentum. A data library can point toward customer, software, or industry data that deserves a closer look.
The operating takeaway is simple: do not let one impressive chart become the whole story. A useful September read pairs the headline signal with the business question it affects. If the number points to tighter labor, the next question is whether your schedule has enough slack. If it points to stronger demand, the next question is whether your dispatch process can absorb it without stretching arrival windows. That is how field service statistics 2026 should turn into management work instead of a slide in a meeting.
Labor market watch
Labor is the first place many owners feel the market before they can prove it in a spreadsheet. The signs are familiar: more time spent recruiting, a thinner bench for peak weeks, more pressure on senior technicians, and more sensitivity around overtime. A monthly labor watch should not try to reduce that reality to one magic number. It should give the office a disciplined way to compare outside signals with what is happening inside the company.
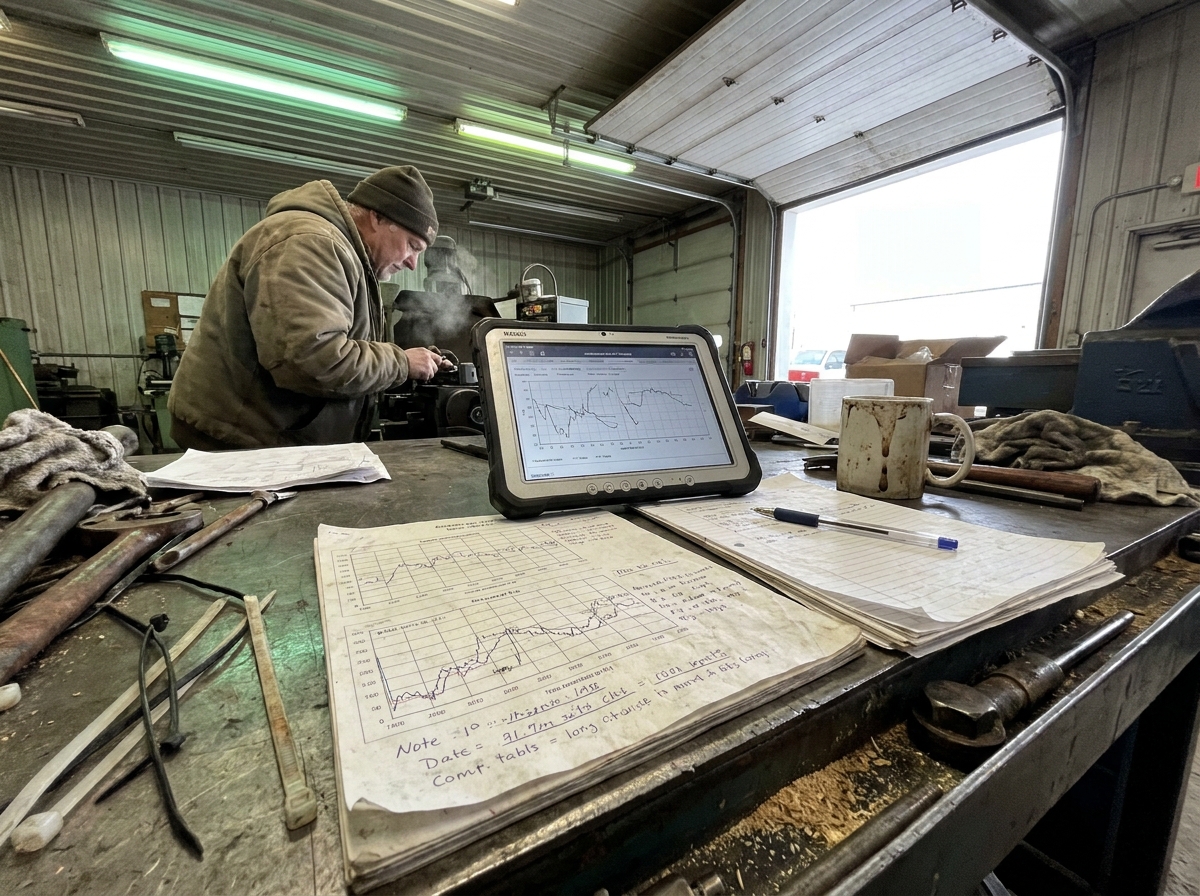
Read the labor section as a staffing conversation. The BLS page can provide a neutral starting point for occupation context, while your own schedule shows the sharper truth: which jobs require the most experienced technician, which callbacks consume senior capacity, and where a junior tech can work safely with the right checklist. That is where field service statistics for small business become practical. The useful question is not whether the national market feels tight. It is whether your calendar is built as if every technician is interchangeable.
This is also where competitor keywords can mislead the discussion. A ServiceTitan alternative, a Jobber alternative, or another ServiceTitan field workflow will not solve a labor constraint by itself. Software can make capacity visible, reduce avoidable handoffs, and help dispatchers protect the right people for the right work. It cannot create experienced technicians out of thin air. Treat labor data as a reason to tighten job classification, skill tags, and escalation rules before the busy period exposes the gaps.
Demand & seasonality signals
Demand data is easy to overread because field service demand is local, seasonal, and trade-specific. A national market signal may be directionally useful, but it does not tell a plumbing, HVAC, electrical, cleaning, landscaping, or facilities business what next Tuesday will look like. The better use is to compare broad market movement with your own leading indicators: booked estimates, repeat customers, emergency calls, quote age, weather-sensitive categories, and the number of jobs waiting for parts.
Sources such as IBISWorld, Grand View Research, Statista, and industry publications can help an analyst understand the wider category, but the dispatch board needs a narrower translation. If demand appears to be shifting, ask which part of the operation feels it first. Is the phone busier? Are customers accepting later windows? Are jobs clustering by geography? Are certain service lines creating longer routes or more return visits?
That is also how to improve field service statistics inside the company: connect external signals to internal measures that someone can act on. A demand note should end with a planning choice. Hold a buffer for urgent work. Open fewer low-margin slots on peak days. Move estimates to quieter windows. Watch for patterns before they become overtime. The value is not the phrase field service trends; it is the habit of turning demand movement into a scheduling rule.
Technology & AI adoption
Technology and AI adoption deserve a place in a September roundup, but they should not take over the article. In operations, adoption matters only when it changes the work: faster intake, cleaner job notes, better route planning, fewer forgotten follow-ups, clearer customer windows, or less manual reporting. A field service statistics software discussion should begin with those jobs, not with a product category.

For broader operating context, the McKinsey operations insights library is useful because it keeps technology tied to process, productivity, and management systems. Trade coverage from Field Service News can also help readers see how practitioners talk about adoption in the field. Use those sources as prompts, then test the idea against your own workflow: where does information get retyped, where does a dispatcher wait for a technician update, and where does a customer call because the system did not explain the window clearly enough?
The best technology reading is skeptical without being cynical. AI can help with summaries, routing support, customer replies, or exception review, but the business still needs clean data and rules. If job types are vague, arrival windows are unrealistic, or technician notes are inconsistent, automation will mostly speed up confusion. The practical benchmark is whether the tool improves the next dispatch decision. That is a better standard than chasing every new field service statistics cost claim attached to a software pitch.
What it means for your dispatch board
The dispatch board is where the roundup either becomes useful or disappears. Owners and analysts should end each monthly review with a short list of operating questions: which crews are overloaded, which job types need more time, which routes are too fragile, which customers need earlier communication, and which service lines deserve closer reporting next month.
A simple monthly format works well. Start with the headline signal. Add one labor note, one demand note, and one technology or process note. Then write one dispatch action beside each. If the labor note points to capacity risk, protect senior techs for complex jobs. If the demand note points to a seasonal shift, adjust the slot mix. If the technology note points to better intake, tighten the fields that dispatchers actually use.
For owners comparing tools, this is a healthier frame than asking for field service statistics tips in isolation. Ask which system makes your real operating questions easier to answer. Can you see schedule pressure by trade, job type, and technician skill? Can you compare booked work with completed work without exporting half the back office? Can you spot field service statistics examples that explain a bad week before it becomes a bad month?
The September takeaway is disciplined, not dramatic. Treat outside numbers as a way to sharpen internal questions. Cite the source, name the operating implication, and put the lesson somewhere the dispatcher can use it. That is how monthly industry data becomes a better board, a steadier crew, and a cleaner conversation about what the business should do next.
#Stats#Data#Monthly#FieldService#IndustryInsights#Trends#Leadership#FieldOps#SmallBusiness#dispatch#scheduling#AI#automation#SaaS#B2B#Productivity